

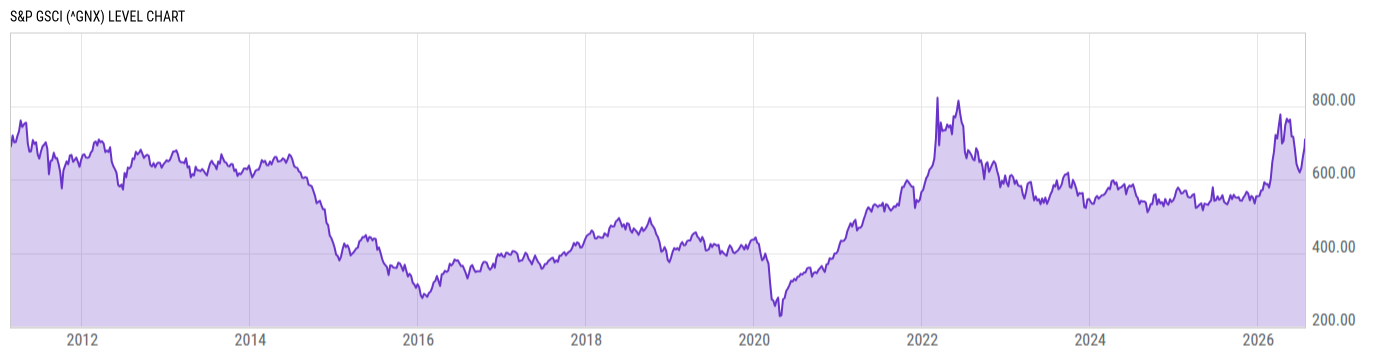
S&P GSCI (^GNX)
712.00
+15.43
(+2.21%)
USD |
Jul 23, 23:10
Level Chart
Key Stats
Basic Info
| The S&P GSCI serves as a benchmark for investment in the commodity markets and as a measure of commodity performance over time. It is a tradable index that is readily available to market participants of the Chicago Mercantile Exchange. The index was originally developed in 1991, by Goldman Sachs. In 2007, ownership transferred to Standard & Poor's, who currently own and publish it. Futures of the S&P GSCI use a multiple of 250. The index contains a much higher exposure to energy than other commodity price indices such as the Dow Jones-UBS Commodity Index. | |
| Core Index Name | S&P GSCI |
| Return Type | Price Return |
| Currency Code | USD |
| Category Hedge Type | Not Hedged |
Index Varieties
| Return Types | |
| Excess Return | S&P GSCI Excess Return |
| Total Return | S&P GSCI Total Return |
Total Return Performance
As of July 22, 2026.
Returns for periods of 1 year and above are annualized.
Annual Performance
As of July 23, 2026.
Basic Info
| The S&P GSCI serves as a benchmark for investment in the commodity markets and as a measure of commodity performance over time. It is a tradable index that is readily available to market participants of the Chicago Mercantile Exchange. The index was originally developed in 1991, by Goldman Sachs. In 2007, ownership transferred to Standard & Poor's, who currently own and publish it. Futures of the S&P GSCI use a multiple of 250. The index contains a much higher exposure to energy than other commodity price indices such as the Dow Jones-UBS Commodity Index. | |
| Core Index Name | S&P GSCI |
| Return Type | Price Return |
| Currency Code | USD |
| Category Hedge Type | Not Hedged |
Index Varieties
| Return Types | |
| Excess Return | S&P GSCI Excess Return |
| Total Return | S&P GSCI Total Return |